
Income Generator: Monetizing Macro Moments
George Bory and Maulik Bhansali explain how policy shifts, artificial intelligence (AI) financing, and global divergence are reshaping fixed income markets, creating opportunities for income generation, flexibility, and selective positioning.

Key takeaways
- Volatility can create opportunity: Abrupt changes in monetary or fiscal policy can produce tactical openings across yield curves, duration, and sectors.
- More yield, less duration: Nominal yield drives bond returns, but positive real yield helps grow purchasing power over time. Strong positive real yield allows investors to take duration selectively rather than rely heavily on broad rate calls.
- Active management connects macro and micro: Financing requirements to build AI infrastructure coupled with global policy divergences are creating meaningful relative value differences across issuers, structures, sectors, and countries.
Nothing happens in isolation
Much of the market commentary surrounding fixed income isolates one question at a time: What will central bankers do next? How will governments fund widening deficits? Will financial repression work? What will the AI buildout mean for credit markets? How do we manage around global supply-side shocks? In practice, nothing happens in isolation and these forces are increasingly intertwined.
The new macro environment rewards investors who quickly respond when markets reprice rather than build portfolios around a single event or economic forecast. The Federal Reserve (Fed) may be providing less forward guidance, but global central bankers set the price of money. Fiscal policymakers want to influence the shape of a country’s yield curve. Additionally, governments are in direct competition with a surging private sector capital investment cycle for funding. Each shift can create a macro moment, a period when prices don’t move at the pace of fundamentals and active investors have an opportunity to adjust.
Three macro moments are shaping the fixed income opportunity set today: tension between fiscal and monetary policy, the enormous financing needs behind AI infrastructure, and increasingly divergent global economic priorities. Each of these forces is contributing to more frequent repricing across rates and global credit markets, creating opportunities for investors who can stay liquid and adjust exposures as relative value changes.
Macro moment 1: Monetary vs. fiscal policy
Persistent global inflation appears to be pressuring many central banks to embark on a mid-cycle adjustment to tighten policy rather than a full tightening cycle. Our working expectation is that the Fed will raise rates twice over the next six months and other central banks will follow suit. With front-end yields likely to rise, some fiscal policymakers want to manage yields at the long end of the curve. The risk is that inflation fails to cool sufficiently and policymakers are forced to respond more aggressively. With less Fed-speak to guide expectations, investors are left to evaluate labor data, inflation releases, policy meetings, and geopolitical developments independently.
Based on this outlook, we believe that an advantageous portfolio positioning can be best summarized as less duration, more yield. That is not to be confused with avoiding long-dated bonds. A modest allocation can provide meaningful duration exposure without requiring a portfolio to make an all-or-nothing bet on falling rates.
Value in bonds: U.S. “real” yield curve
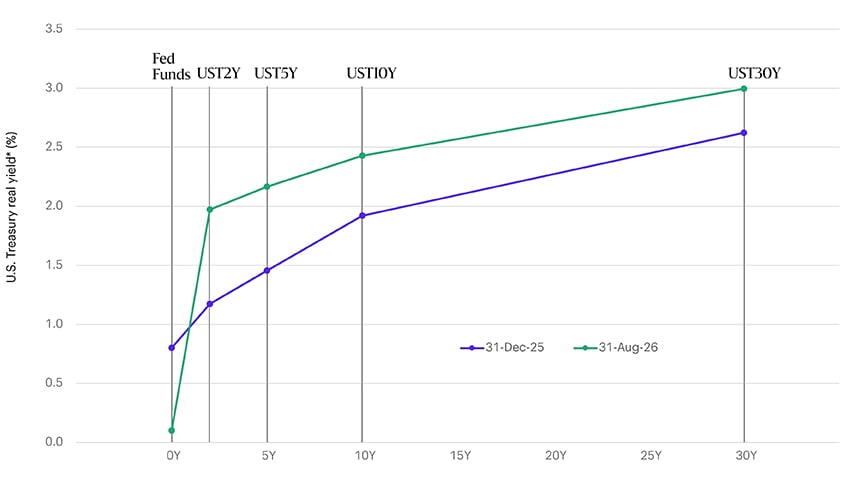
Source: Bloomberg Finance L.P. U.S. Treasury pricing is represented by Bloomberg’s generic pricing of U.S. Treasury yields. *Real yield = nominal yield less breakeven inflation. Data as of 31-Aug-26.
Regarding the shape of the curve, a flatter yield curve seems likely, but an investor cannot simply put on one curve trade and hold it while expectations move dramatically in both directions.
Macro moment 2: AI funding—from macro to micro
The AI infrastructure build-out is another macro moment, and its financing requirements are already reshaping global bond markets. Early estimates placed planned investment near $6 trillion by 2030. More recent industry estimates are closer to $8 trillion, with some as high as $10 trillion. At least two-thirds are expected to be financed through global debt markets, including public bonds, leveraged loans, private credit, and securitized debt.
Borrowing on that scale is on par with government funding needs and has changed the relative value picture across the market. Only six months ago, many hyper-scalers traded tighter than the broader investment-grade market. They now trade more than 40 basis points* wider, an approximately 60-basis-point swing for a group of largely AA-rated issuers. Meanwhile, much of the corporate bond market outside hyper-scalers has remained comparatively stable.
Hyper-scalers’ debt breakout from the rest of the market
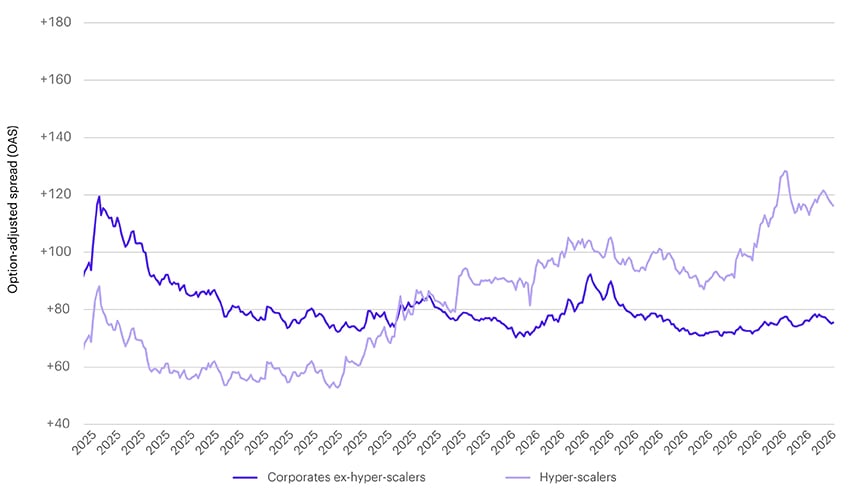
Sources: Allspring and Bloomberg Finance L.P., as of 31-Aug-26. Hyper-scalers include SPCX, ORCL, NVDA, META, GOOGL, AMZN, and MSFT. This is not a recommendation to purchase or sell any particular security.
This has created a tale of two credit markets. For active investors, the opportunity is to move from the macro theme to the micro structure. Each new issue must be evaluated against the issuer’s future funding needs, the specific asset being financed, and the compensation available relative to other high-quality bonds.
For example, financing tied to discrete data centers can offer more favorable technicals compared with broad exposure to the parent company. Once an individual data center is funded, that specific funding requirement is complete. A parent company, by contrast, may be financing several additional facilities through successive bond offerings. That difference can influence how much supply pressure an investor ultimately absorbs and the relative value between bonds.
Again, this is where active management becomes important. AI may be a broad secular theme, but bondholders are paid through individual structures, covenants, maturities, and spreads. The ability to compare them across public credit, securitized debt, and other channels can turn a large macro event into a series of value-enhancing relative value decisions.
Macro moment 3: Global divergence broadens the opportunity set
Policy repricing has not been limited to the United States. Shifts in expectations across developed and developing markets have driven interest rate volatility higher and created tactical opportunities along different sectors and yield curves.
Securitized products such as mortgaged-backed securities (MBS) and asset-based securities allow bond investors to focus on discrete pools of receivables rather than the idiosyncratic nature of one borrower. These defined cash flows can provide much-needed diversification to bond portfolios.
MBS opportunity set broadens as volatility increases
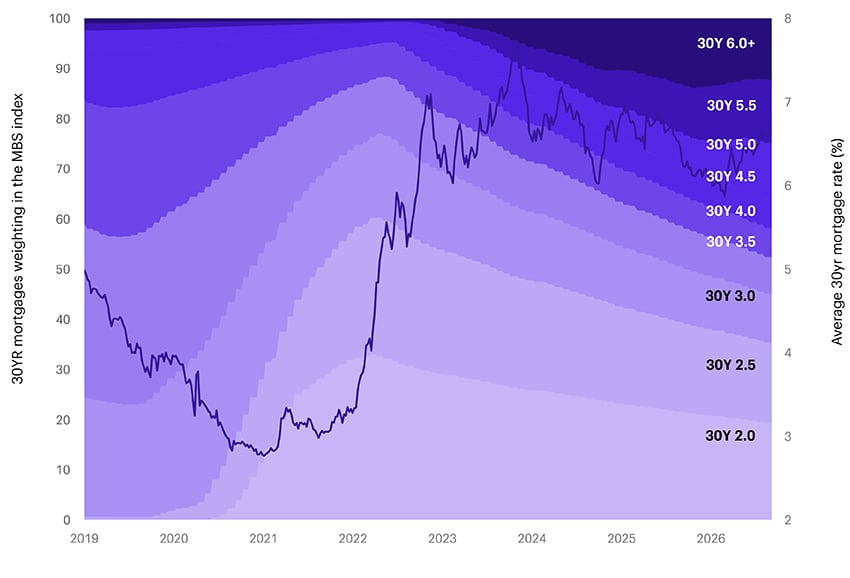
Sources: Allspring, Bloomberg Finance L.P., and J.P. Morgan Markets. As of 31-Aug-26. MBS index = Bloomberg U.S. MBS Index.
U.S. agency MBS are especially useful in bond portfolios because they combine liquidity, income, and (favorable) sensitivity to interest rate volatility. Wide price dispersion across the coupon stack of MBS affords an additional layer of relative value opportunities to enhance yields and returns. In today’s world of elevated interest rates, we prefer higher-coupon mortgages for additional yield and are also finding opportunities in adjustable-rate mortgages and collateralized mortgage obligations.
Debt issued by U.S. municipalities can offer attractive value for those looking for defensive carry. Their fundamentals and revenue sources can provide some buffer against the vagaries of the AI financing cycle and geopolitical tensions erupting around the world.
Still, a global approach to bond investing matters because developed markets are confronting heavy government borrowing, above-target inflation, and varying levels of growth. Shifts in expectations for tighter monetary policy in several developed markets, such as the United Kingdom, Europe, and Australia, have created tactical opportunities at the front end of local yield curves. Emerging markets face their own set of challenges, but they tend to be commodity rich with considerable natural resources.
Emerging market debt is delivering mixed results
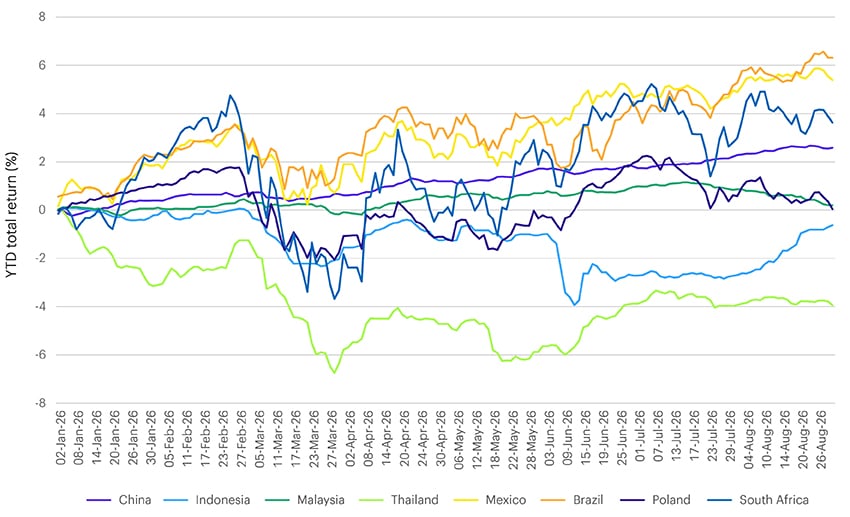
Sources: Allspring, Bloomberg Finance L.P., and J.P. Morgan Markets. As of 31-Aug-26. China = Bloomberg China Treasury Total Return Index CNY; Indonesia = Bloomberg EM Local Currency: Indonesia (BINDO) Total Return Index Unhedged IDR; Malaysia = Bloomberg EM Local Currency: Malaysia Total Return Index Unhedged MYR; Thailand = Bloomberg EM Local Currency: Thailand Total Return Index Unhedged THB; Mexico = Bloomberg EM Local Currency: Mexico Total Return Index Unhedged MXN; Brazil = Bloomberg EM Local Currency: Brazil Total Return Index Unhedged BRL; Poland = Bloomberg EM Local Currency: Poland Total Return Index Unhedged PLN; South Africa = Bloomberg EM Local Currency: South Africa TR Index Unhedged ZAR.
In addition, emerging market economic growth rates tend to be higher compared with developed markets. Both factors are distinct advantages in today’s supply-side constrained world. Opportunities in countries such as Mexico, Brazil, and South Africa can add another source of income and diversification, particularly where local-currency markets reflect distinct inflation and policy cycles.
A road map built more for reaction, less for prediction
Rates, inflation, fiscal policy, and geopolitics will keep forcing markets to reassess the future, but investors don't need to predict every turn. In the current environment, the playbook is to maintain enough liquidity to respond, allow income to do much of the work, and use periods of repricing to adjust exposure when relative value changes.
In an environment with less policy guidance and more frequent market repricing, flexibility can be more valuable than building a portfolio around a single high-conviction forecast.
The path for rates, inflation, fiscal policy, and geopolitics will remain uncertain. When markets repeatedly reassess the future, a flexible active approach can convert repricing episodes into opportunities while income continues to do much of the work in a bond portfolio.
Related insights

George Bory, chief investment strategist for Allspring Fixed Income, explains how active bond investing can enhance outcomes by focusing on investor needs, weighing opportunity costs, and capitalizing on market inefficiencies.

Janet Rilling reviews the dynamic market shifts of Q1, strategies for navigating Q2, and her team’s disciplined approach to managing through volatility.

George Bory and Jamie Newton discuss global credit markets amid rising dispersion, structural shifts, and AI-driven investing, urging fixed income investors to consider active strategies with global diversification and sector selectivity.
George Bory explains why bond markets in 2026 should favor discipline and flexibility. Positive real yields, global policy divergence, and credit dispersion may create opportunities for income generation and selective positioning.

Janet Rilling and Hannah Rosencrantz give a Q3 fixed income market update—discussing strong bond performance, potential risks in credit compensation, and strategies for building resilient portfolios in Q4.

Nick Venditti, head of Municipal Fixed Income at Allspring Global Investments, talks about how, for the first time in a while, the higher education sector is starting to show signs of distress.
Definitions:
Bloomberg China Treasury Total Return Index CNY
The Bloomberg China Treasury Total Return Index CNY measures the performance of local-currency Chinese government bonds. You cannot invest directly in an index.
Bloomberg EM Local Currency: Indonesia (BINDO) Total Return Index Unhedged IDR
The Bloomberg EM Local Currency: Indonesia (BINDO) Total Return Index Unhedged IDR measures the performance of local-currency Indonesian government bonds on an unhedged basis. You cannot invest directly in an index.
Bloomberg EM Local Currency: Malaysia Total Return Index Unhedged MYR
The Bloomberg EM Local Currency: Malaysia Total Return Index Unhedged MYR measures the performance of local-currency Malaysian government bonds on an unhedged basis. You cannot invest directly in an index.
Bloomberg EM Local Currency: Thailand Total Return Index Unhedged THB
The Bloomberg EM Local Currency: Thailand Total Return Index Unhedged THB measures the performance of local-currency Thai government bonds on an unhedged basis. You cannot invest directly in an index.
Bloomberg EM Local Currency: Mexico Total Return Index Unhedged MXN
The Bloomberg EM Local Currency: Mexico Total Return Index Unhedged MXN measures the performance of local-currency Mexican government bonds on an unhedged basis. You cannot invest directly in an index.
Bloomberg EM Local Currency: Brazil Total Return Index Unhedged BRL
The Bloomberg EM Local Currency: Brazil Total Return Index Unhedged BRL measures the performance of local-currency Brazilian government bonds on an unhedged basis. You cannot invest directly in an index.
Bloomberg EM Local Currency: Poland Total Return Index Unhedged PLN
The Bloomberg EM Local Currency: Poland Total Return Index Unhedged PLN measures the performance of local-currency Polish government bonds on an unhedged basis. You cannot invest directly in an index.
Bloomberg EM Local Currency: South Africa TR Index Unhedged ZAR
The Bloomberg EM Local Currency: South Africa TR Index Unhedged ZAR measures the performance of local-currency South African government bonds on an unhedged basis. You cannot invest directly in an index.
Bloomberg U.S. MBS Index
The Bloomberg U.S. MBS Index measures the performance of U.S. agency MBS. You cannot invest directly in an index.
*100 basis points equal 1.00%.
Diversification does not ensure or guarantee better performance and cannot eliminate the risk of investment losses.
Duration is a measurement of the sensitivity of a bond’s price to changes in Treasury yields. A fund’s duration is the weighted average of duration of the bonds in the portfolio. Duration should be interpreted as the approximate change in a bond’s (or fund’s) price for a 100-bp change in Treasury yields. Duration is based on historical performance and does not represent future results.
The ratings indicated are from Standard & Poor’s (S&P), Moody’s Investors Service, and/or Fitch Ratings Ltd. (together, rating agencies). Standard & Poor’s is a trademark of McGraw-Hill, Inc., and has been licensed. The funds are not sponsored, endorsed, sold, or promoted by these rating agencies, and these rating agencies make no representation regarding the advisability of investing in the funds. The credit rating is a forward-looking opinion about a fund's potential capacity to maintain stable principal or stable net asset value. The ratings are opinions as of the date they are expressed and not statements of fact or recommendations to purchase, hold, or sell any security. Standard & Poor's rates the creditworthiness of money market funds from AAAm (highest) to Dm (lowest). Moody's rates the creditworthiness of money market funds from Aaa-mf (highest) to C-mf (lowest). Fitch Ratings Ltd. rates the creditworthiness of money market funds from AAAmmf (highest) to Bmmf (lowest).
All investing involves risks, including the possible loss of principal. There can be no assurance that any investment strategy will be successful. Investments fluctuate with changes in market and economic conditions and in different environments due to
numerous factors, some of which may be unpredictable. Each asset class has its own risk and return characteristics.
This material is provided for informational purposes only and is intended for retail public distribution in the United States. Use outside the United States is for professional/qualified investors only.
CFA® and Chartered Financial Analyst® are trademarks owned by CFA Institute.
ALL-09152026-rdfncwba